This is an R Markdown Notebook. When you execute code within the notebook, the results appear beneath the code.
Try executing this chunk by clicking the Run button within the chunk or by placing your cursor inside it and pressing Ctrl+Shift+Enter.
hello
plot(cars)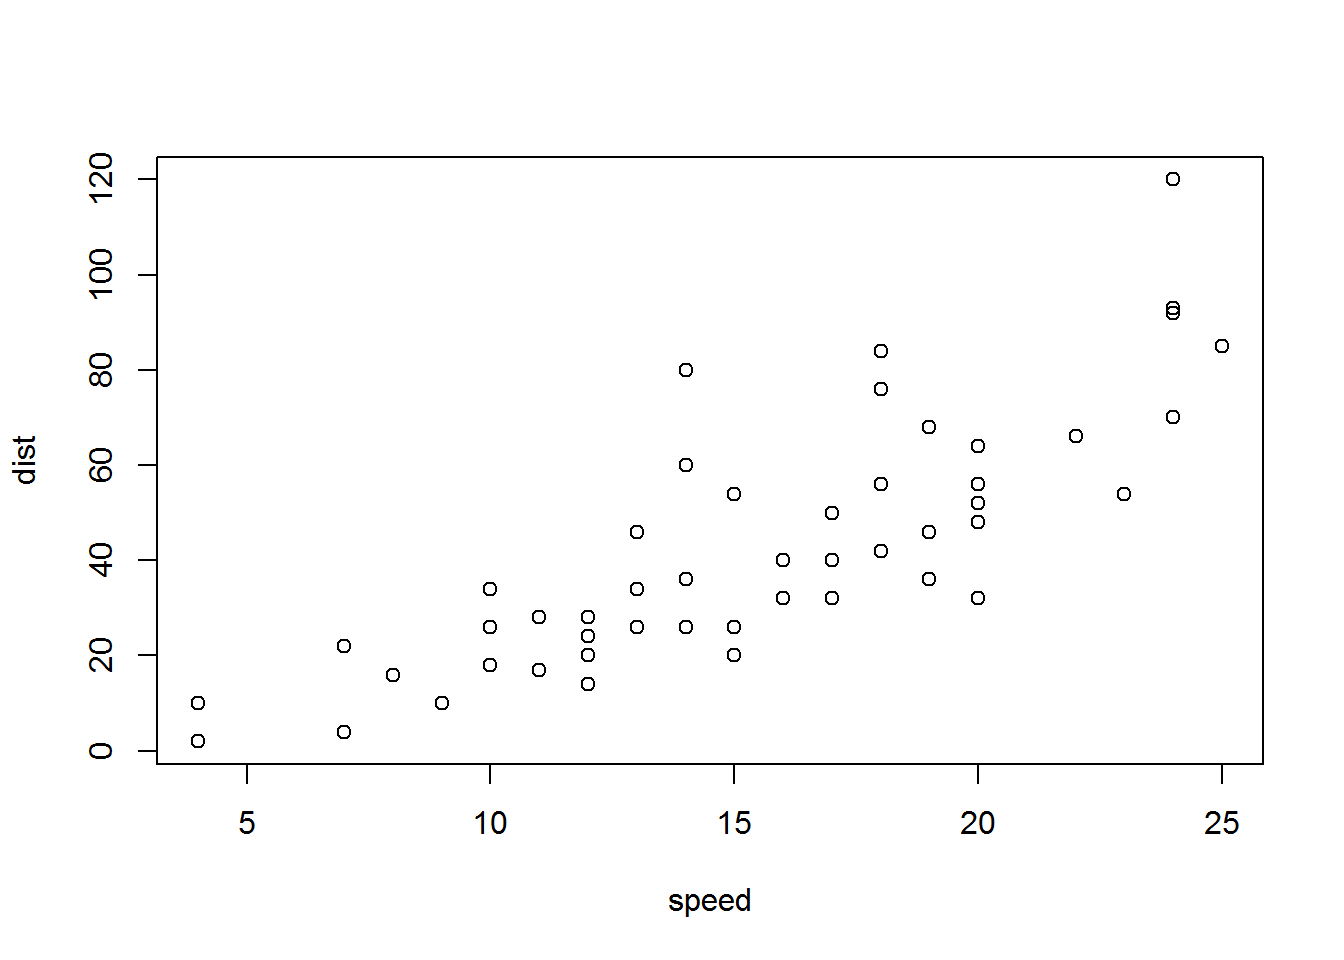
Add a new chunk by clicking the Insert Chunk button on the toolbar or by pressing Ctrl+Alt+I.
hello1
When you save the notebook, an HTML file containing the code and output will be saved alongside it (click the Preview button or press Ctrl+Shift+K to preview the HTML file).
hello1a
The preview shows you a rendered HTML copy of the contents of the editor. Consequently, unlike Knit, Preview does not run any R code chunks. Instead, the output of the chunk when it was last run in the editor is displayed.
library(ggplot2)
head(diamonds)
## # A tibble: 6 x 10
## carat cut color clarity depth table price x y z
## <dbl> <ord> <ord> <ord> <dbl> <dbl> <int> <dbl> <dbl> <dbl>
## 1 0.23 Ideal E SI2 61.5 55 326 3.95 3.98 2.43
## 2 0.21 Premium E SI1 59.8 61 326 3.89 3.84 2.31
## 3 0.23 Good E VS1 56.9 65 327 4.05 4.07 2.31
## 4 0.290 Premium I VS2 62.4 58 334 4.2 4.23 2.63
## 5 0.31 Good J SI2 63.3 58 335 4.34 4.35 2.75
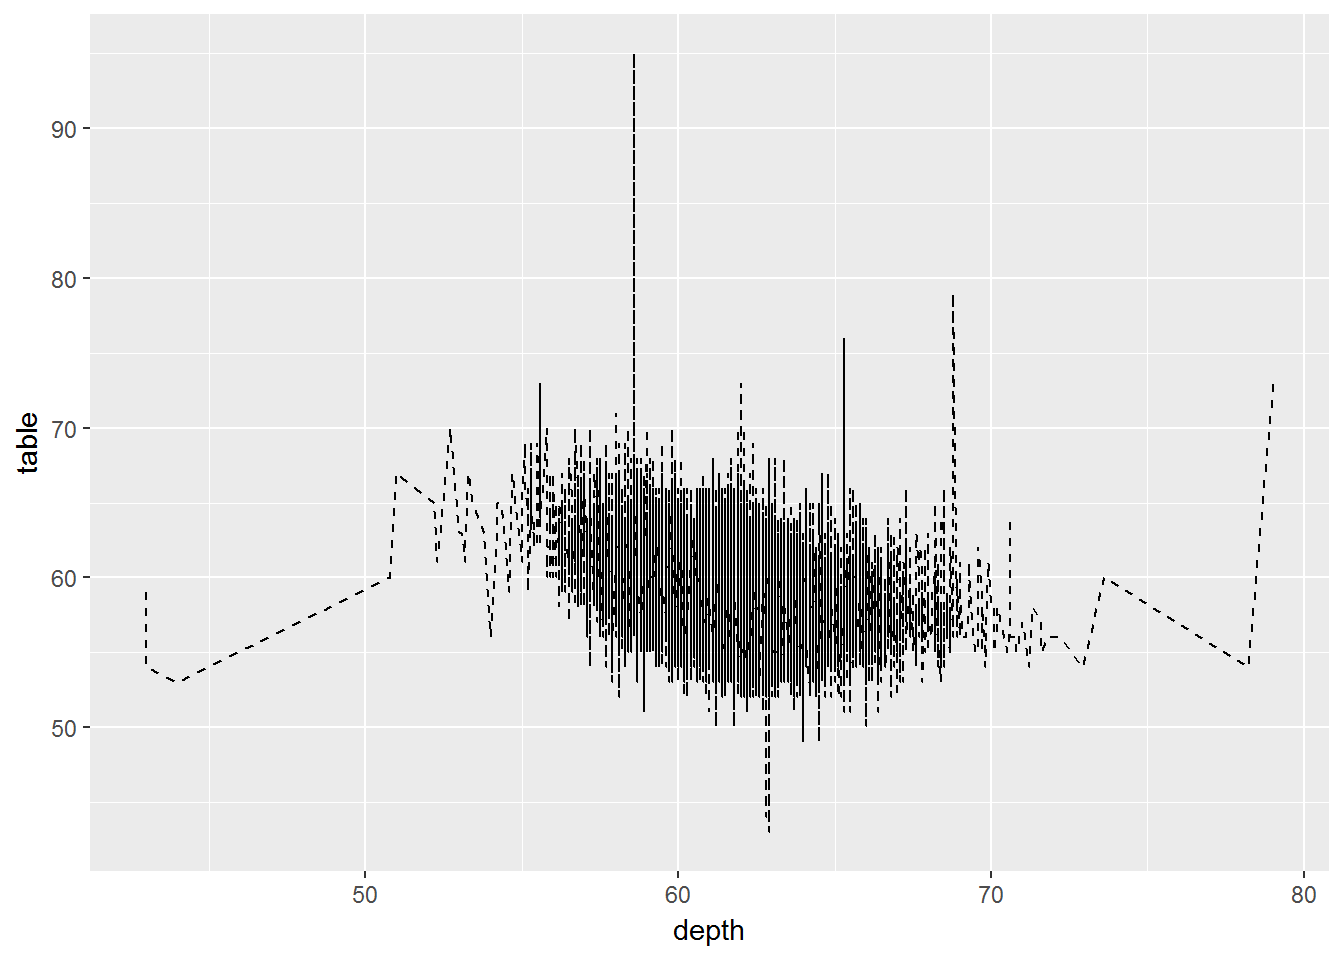
## 6 0.24 Very Good J VVS2 62.8 57 336 3.94 3.96 2.48ggplot(diamonds) +
geom_line(aes(depth, table), linetype = 2)